A survey concerning reading ebooks vs printed books
Surveys usually help us in improving or making adjustments to products or services. As well as to educate and attempt to explain questions. These may shape different aspects of our life. Surveys allow us to learn the insights and opinions of other people. One survey conducted by USA Today wanted to see if people prefer printed books over electronic ones. There were 281 respondents of which 35% preferred electronic books, while 65% preferred printed books. This survey may seem to suggest that most people rather read printed books than ebooks.
One of the main objectives of statistics is critical thinking. One should not blindly accept the results that are presented. Questioning the validity of survey results is important. Asking questions such as, “How were the respondents chosen?” or “Who is conducting this survey?”, are a couple of important questions to ask before accepting results.
Misleading Information, Deceptive Charts, and Data

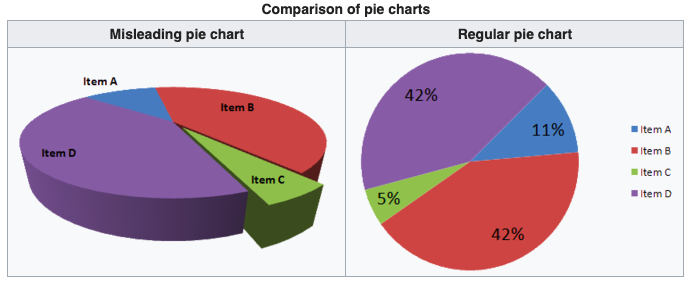
The information and results gathered and presented must be tested to ensure validity. The chart presented above shows the same pie chart from different positions. We see on the left pie chart, item C is shown and represented in a way that is similar from the current position to item A. But when we see the pie chart from above (image on the right) we see item C is more than double the size of item A.
Flaws to be aware of:
As mentioned above one of the flaws to look for when analyzing survey results is misleading graphs and misrepresentation of data. Another flaw to look for is when the survey is done using bad sampling methods. In our USA Today survey, the survey was made available to those willing participants who visited the USA Today site. This type of sample is a voluntary response sample. This is a sample in which the respondent decided whether or not they would like to participate in the survey. These type of surveys usually aren’t the greatest, since people who decide to participate usually have a strong interest in the topic mentioned (or else they wouldn’t willingly choose it). For this reason, the results may be questionable.
Things to consider when collecting sample data
- The sample data which is collected should be collected using an appropriate method, such as random selection.
- If sample data is not collected using an appropriate method, the data may be useless.
Using results blindly may seem accurate after conducting much research, yet if we miss the flaws described in the list above, we may produce fundamentally misleading or even wrong results. Statistical thinking, as well as critical thinking, can help understand when a survey is flawed.
Throughout the rest of these blog posts concerning statistics, we will hopefully conquer the following objectives.
- Critical thinking and statistical thinking.
- We should be able to analyze some sample data which is relative to its context, as well as source and sampling method.
- Understand the main differences between practical significance as well as statistical significance.
- We should be able to identify as well as define a voluntary response sample, as well as know that statistical conclusions that are based on certain data from the sample are generally not valid.
- Different types of data
- What is the difference between a statistic and a parameter?
- What is the difference between discrete data and continuous data?
- Check whether our basic statistical calculations are correct and appropriate regarding a particular data set.
- What are the difference between categorical (attribute or qualitative) and quantitative data?
- Sample Data Collecting
- Identify and define what a simple random sample is.
- Know what the importance is regarding sound sample methods and good design regarding our experiments.